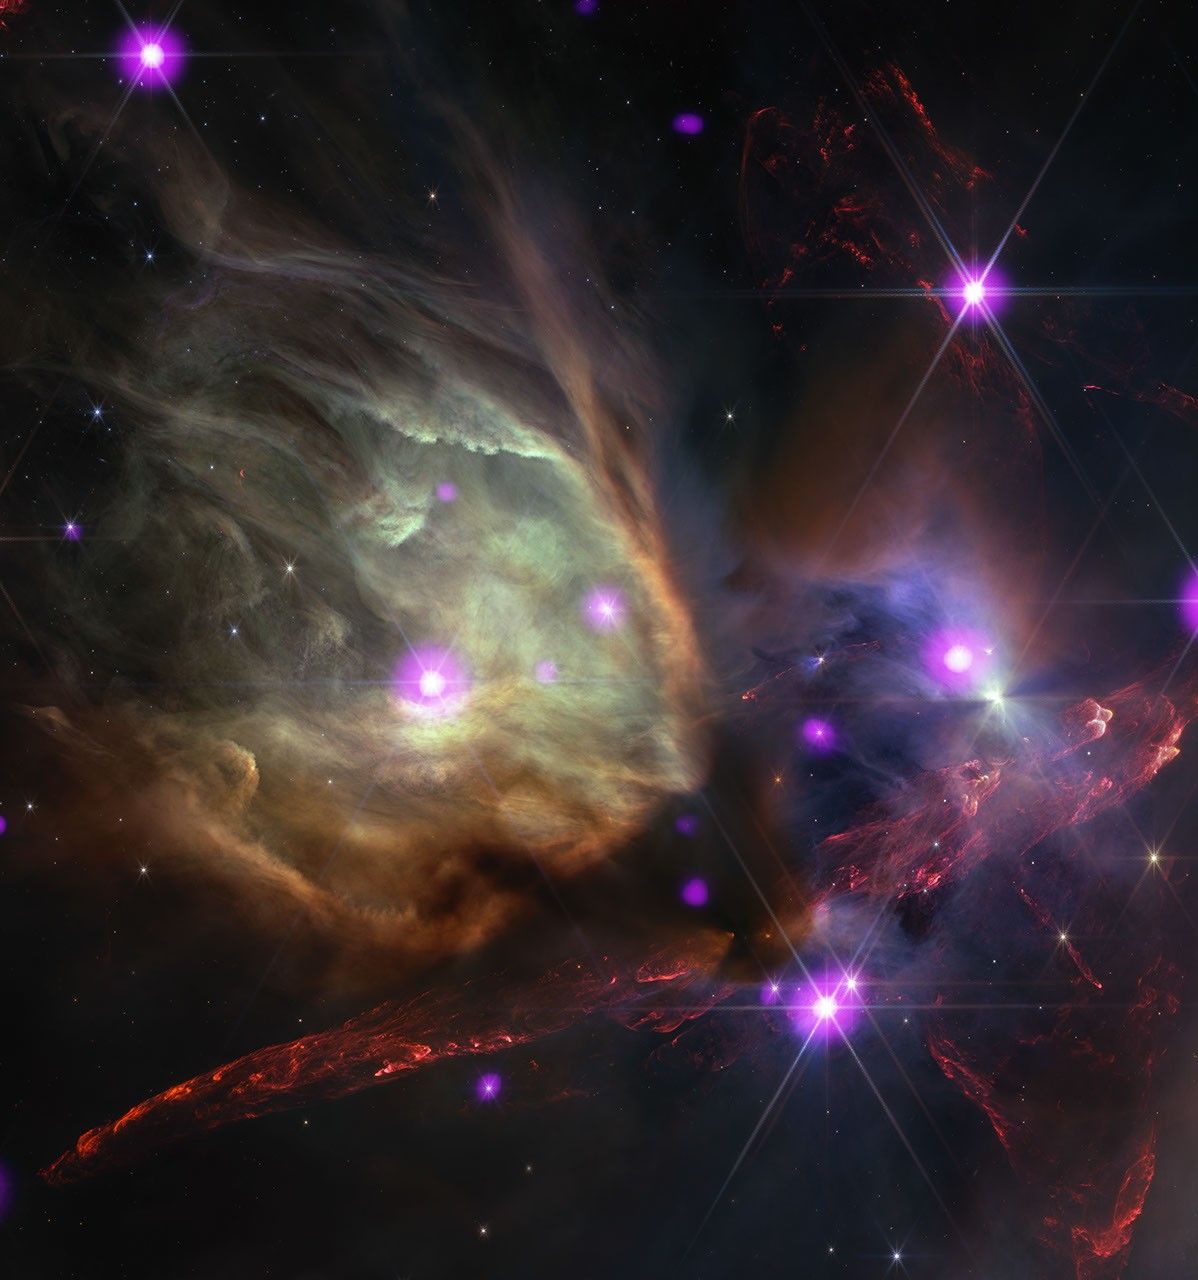
NASA recently released a collection of what they are calling baby star sounds. It is the latest output from the Chandra X-ray Observatory, where scientists take raw data from young, forming stars and run it through a process called sonification. It basically turns visual and electromagnetic data into audio frequencies.
On the surface, this feels like a PR play to get people excited about space. But for those of us building in data science and AI, there is a much deeper lesson here about how we interpret messy signals. These stars are chaotic environments. They are massive clouds of gas and dust collapsing under their own weight, emitting X-rays that we can barely wrap our heads around as flat images. By moving that data into the auditory spectrum, NASA is essentially changing the UI of the universe.
The Multi-Modal Shift
In the crypto and AI space, we spend a lot of time looking at dashboards. We look at candlesticks, heatmaps, and terminal logs. We assume that the human eye is the best tool for spotting a pattern. NASA is challenging that assumption. They are taking data from Chandra, Hubble, and Spitzer, and they are layering it into a soundscape where different instruments represent different light wavelengths.
Think about a developer trying to debug a complex smart contract or a neural network that is hallucinating. Usually, you are scanning thousands of lines of logs. What if that data had a frequency? What if a specific type of error produced a dissonant chord? That is the logic behind sonification. It uses the human brain's natural ability to detect rhythm and pitch to find anomalies that a visual scan might miss.
Why Founders Should Care About Data Translation
If you are building a startup right now, you are likely sitting on a mountain of underutilized data. The traditional approach is to build a better chart. But the lesson from Chandra is that sometimes a better chart is not the answer. Sometimes you need a different sense entirely.
Building a builder-first product means making the invisible visible. Or in this case, making the invisible audible. When NASA maps X-ray data to a pitch, they are doing feature engineering. They are deciding which data points matter and how to represent them so that a human can gain intuition about the system. For a founder, this is a masterclass in UX. It is not about the data itself; it is about the bandwidth of the person receiving it.
The Noise Problem in Early-Stage Systems
Baby stars are noisy. They emit massive flares and have turbulent magnetic fields. This is exactly what it feels like to build a protocol in its first six months. You have a lot of signals coming in from users, markets, and code audits, and most of it is just static.
NASA's sonification projects like the Rho Ophiuchi cloud complex or the Orion Nebula show us how to layer this noise. They use different sounds for different data sets. High-energy X-rays might be a high-pitched whistle, while infrared data might be a low drone. By layering these, you get a full picture of the environment.
When you are building, you need to develop your own internal sonification. You need to know which signals are the high-pitched X-rays (immediate threats) and which are the low-infrared drones (long-term trends). If you treat all data as the same frequency, you just get a wall of noise that leads to burnout.
Building for Accessibility and New Perspectives
There is also a practical side to this that builders often ignore: accessibility. NASA started these projects partly to help people with visual impairments experience space data. In tech, we often build for a very narrow demographic of power users who see the world exactly like we do.
If you can build a tool that translates complex data into something a non-technical stakeholder can feel or hear, you have won. Whether it is an AI model that explains its reasoning in plain English or a blockchain explorer that uses haptic feedback to signal a confirmed transaction, these sensory translations are where the next 100 million users will come from.
Practical Application for AI Builders
Right now, everyone is obsessed with LLMs and text. But the real frontier is multi-modal. NASA is doing with X-rays what we are trying to do with vector databases. We are trying to find the relationship between disparate points in a high-dimensional space.
If you are an AI founder, look at how NASA maps the positions of stars to a horizontal axis to determine timing. They are literally temporalizing spatial data. This is a core problem in machine learning. How do we take static data and understand its movement over time? By turning it into a song, NASA has solved the visualization of time-series data in a way that feels intuitive.
The Skeptic's Take
I will be honest: a lot of this is still just art. You aren't going to discover a new planet just by listening to a MIDI file of the Crab Nebula. But as a tool for intuition, it is unmatched. Most founders fail because they lose their intuition. They get buried in the spreadsheet and forget what the actual heartbeat of their company sounds like.
We need to stop looking at data as something to be managed and start looking at it as something to be experienced. The more ways we have to interact with our systems, the less likely we are to be blindsided by a black swan event. If your system starts sounding "off," you'll know long before the chart shows a dip.
The Takeaway
NASA’s baby star album is a reminder that data is flexible. It doesn't have to stay in the box we found it in. For builders, the message is clear: stop obsessing over better visuals and start thinking about better signals. If you can change how people perceive your data, you change how they understand your product. Whether you are building a decentralized exchange or a new LLM agent, find the rhythm in your data. It is usually telling you exactly what is wrong if you are willing to listen.
Read the original at NASA Breaking News →