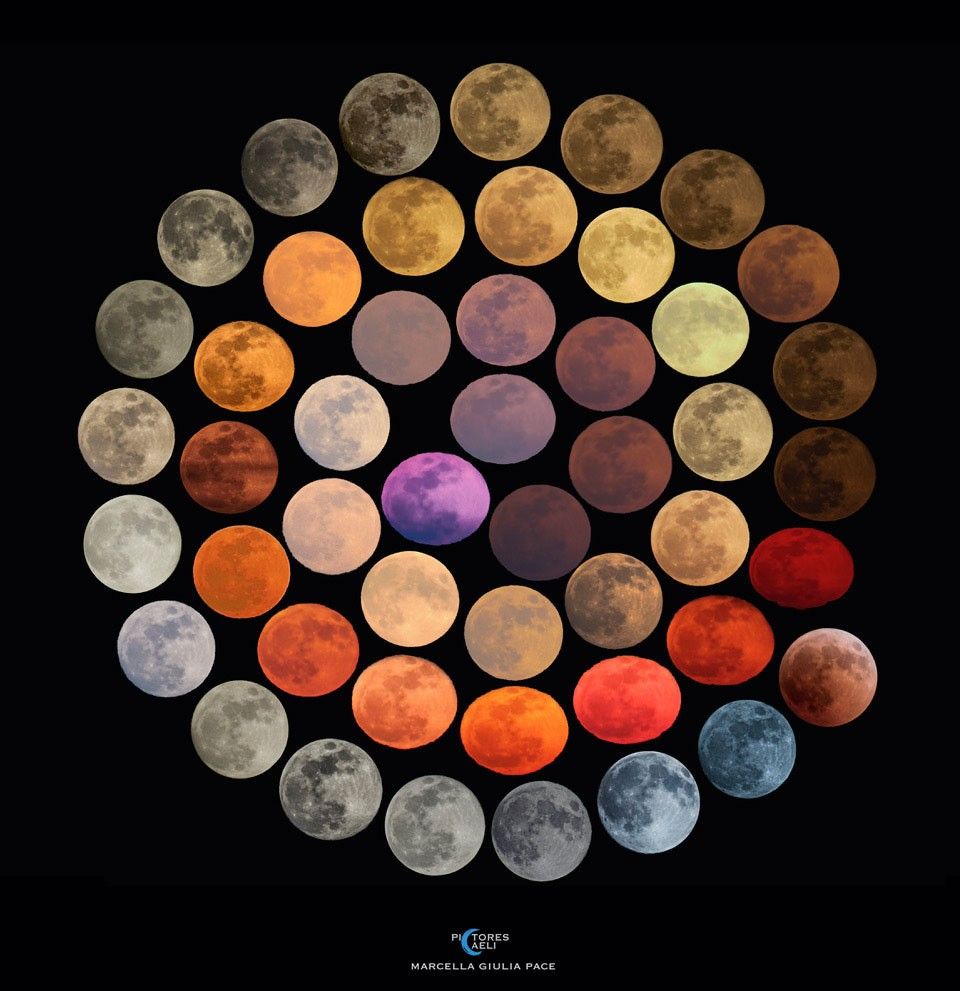
When you look up at the night sky, you see a monochromatic rock. It is gray, dusty, and visually stagnant. But NASA just released a detailed breakdown of the moon’s mineral composition, visualized through color enhancement, that reminds me exactly why most people fail to understand complex technology like blockchain or neural networks. They are looking at the surface and missing the chemistry beneath.
As builders, we are constantly told to simplify. We are told to make things intuitive. But there is a massive difference between simplification and stripping away the data that actually makes a system valuable. NASA’s latest analysis of the moon’s surface colors is a perfect case study in how to reveal hidden utility without losing the user.
The Data Behind the Dust
The image provided by NASA isn't just a pretty picture for a desktop background. It is a topographic map of resources. By boosting the saturation and isolating specific wavelengths, astronomers can see exactly where the titanium is, where the iron sits, and where the volcanic glass remains from ancient eruptions. Blue hues indicate areas rich in titanium, while the darker, orange-toned regions suggest a lack of it.
In the world of decentralized finance or AI infrastructure, we have a similar problem. To the average user, a block explorer looks like a wall of gray noise. To a developer, it is a map of liquidity, security risks, and network health. The bridge between these two perspectives is visualization. NASA didn't change the moon; they changed how we process the data coming off it. If you are building a dApp or an LLM dashboard, your job isn't to hide the complexity. It is to color-code it so the user knows where the value is stored.
Why Builders Should Care About Mineral Mapping
I often talk to founders who are obsessed with 'UX.' They want everything to be one click. That is fine for a grocery app, but for a high-stakes financial tool or an enterprise AI agent, one-click simplicity can be dangerous. It hides the 'minerals.' If I am moving $100,000 across a bridge, I don't want a gray moon. I want to see the blue zones of high security and the orange zones of low liquidity.
NASA's use of color-enhancement is essentially a primitive form of what we are trying to do with AI-driven analytics. We are taking massive, messy datasets and trying to find the signal. The moon is a giant dataset that has been sitting there for billions of years, and we are still finding new ways to read it. Your startup is likely sitting on a similar pile of data that your users haven't figured out how to value yet.
The Skeptic's View on Visualization
Let’s be honest: there is a fine line between data visualization and data manipulation. When you see a high-saturation photo of the moon, it looks alien. It isn't what your eyes would see if you were standing in orbit. In the crypto space, we see this all the time with 'vanity metrics.' Founders use bright green charts to show 'growth' while ignoring the 'titanium'—the actual retention and utility of the protocol.
The reason NASA’s work holds up is because the colors are tied to physical realities. The blue is actually titanium. It isn't just blue because it looks good. As a founder, you need to ask yourself if your dashboards and interfaces are reflecting reality or just painting a pretty picture to distract from a lack of substance. If your AI's confidence score is just a random number generator designed to make the user feel safe, you aren't building a tool; you're building a toy.
Applying the 'Lunar Lens' to Product Development
How do you apply this? Start by identifying the 'hidden minerals' in your project. If you are building an AI tool, the minerals are the weights, the biases, and the source data. If you are building in Web3, it is the smart contract logic and the decentralization ratio. These are the things that are usually hidden behind a 'gray' interface.
- Identify the Core Utility: What is the one piece of data that actually matters for a long-term user? For the moon, it is resource location. For your project, it might be latency or cost-per-inference.
- Enhance, Don't Fabricate: Use design to highlight these areas. Don't bury the lead. If a transaction is risky, it should be visually distinct.
- Provide Contextual Layers: NASA doesn't just show the colorful moon; they explain what the colors mean. Your UI needs to educate the user on why a specific metric is 'blue' or 'orange.'
We are entering an era where data density is increasing exponentially. We have more information than we know what to do with, but less insight than ever. The founders who win won't be the ones who build the simplest tools, but the ones who build the best filters. NASA has been doing this for decades, and their ability to turn a boring rock into a resource map is exactly the kind of thinking we need in the tech sector right now.
The goal is not to make the complex simple, but to make the complex visible.
Stop trying to make your product look like a clean, empty room. Start showing your users where the titanium is buried. They might not understand the chemistry at first, but they will quickly learn to look for the blue spots. That is how you build a product that people actually rely on, rather than just something they use once and forget.
Takeaway for the Founder
NASA’s lunar mapping proves that even the most well-known objects in our universe still hold secrets if you look at them through the right lens. Don't take your own data for granted. There is likely a narrative hidden in your backend logs or your smart contract events that could be the key to your next major feature. Find your minerals, color-code them, and stop shipping gray products.
Read the original at NASA Breaking News →